Geography
Population density
Some places are crowded with people. Some places have hardly anyone. Population density tells us how crowded a place is.
Population density tells you how crowded a place is. You find it by dividing the number of people by the area of land they live on, usually as people per square kilometer. Among countries, World Bank figures for 2024 range from more than 18,000 people per square kilometer in Monaco to about 2 in Mongolia. People cluster where there is water, farmland and work, and leave harsh places almost empty.
Population density is population divided by land area; the World Bank's indicator uses midyear population and land area excluding inland water. The world averaged about 62 people per km² in 2023, but averages hide clustering: 95 percent of Egyptians live within a few miles of the Nile. Geographers therefore also use smaller areas and measures such as physiological density, people per unit of farmland.
How crowded is it?
Think of a big playground with just two children. There is lots of space!
Now think of the same playground with a hundred children. It is crowded. Population density tells us how crowded a place is.
Imagine two playgrounds of the same size. One has 5 children in it, and the other has 50. The second is ten times more crowded. Population density measures the same idea for towns, countries and the whole world.
To find it, divide the number of people by the area of land they live on. Geographers usually give the answer as people per square kilometer: the number of people, on average, living on a square of land 1 kilometer long on each side. A high number means a crowded place. A low number means lots of space for each person.
National Geographic defines population density as the number of individuals divided by the size of the area they occupy; for people it is usually given per square kilometer or per square mile and discussed alongside urbanization, migration and demographics. The World Bank's indicator, EN.POP.DNST, is midyear population divided by land area in square kilometers, where land area excludes inland water bodies such as major rivers and lakes, as well as continental-shelf claims and exclusive economic zones.
The definition matters because the denominator changes the answer. Using land rather than total area, counting residents regardless of legal status (the World Bank's de facto population), and choosing the year all shift the result. A density figure therefore always comes with three labels: whose count, which area and which year.
Counting people
To know how crowded a place is, we need to count the people. Countries do this with a census.
A census asks every home how many people live there.
Before you can work out population density, you need to know how many people there are. Many countries count everyone in a census. In the United States, the Constitution requires a count every 10 years, and the U.S. Census Bureau carries it out. China also holds a census once a decade.
The United Nations gathers figures from around the world. Its population experts publish estimates for 237 countries and areas, going back to the 1950s. Some countries also use new tools: China studies satellite pictures of lights at night to check where people live.
National Geographic notes that the United Nations Statistics Division tracks density globally, while countries collect their own data, often by census: decennial in the United States (a constitutional requirement carried out by the Census Bureau) and in China, which uses it for economic and social planning. Newer methods supplement counts: China analyzes nighttime light data from space sensors to confirm densities and predict change, and other countries use algorithms to project census data. UN DESA's World Population Prospects 2024 provides estimates for 237 countries or areas from the 1950s to the present, with projections to 2100.
Counts can be incomplete. Censuses may miss nomadic people, migrants, refugees, people experiencing homelessness, residents of informal settlements and people without clear citizenship status, as well as residents of conflict zones or remote areas; where forms replace census takers, low literacy can add error. Independent research groups help where governments lack resources.
Packed places, empty places
Some small countries are packed with people. Monaco and Singapore are very crowded.
Other countries are huge, with few people. Mongolia and Australia have lots of open space.
World Bank figures for 2024 show huge differences. Monaco, a tiny country on the Mediterranean coast, has about 18,537 people per square kilometer. Singapore has about 8,329, and Bangladesh about 1,333, the highest of the bigger countries on this page. India has about 488, and Japan about 340.
At the other end, the United States has about 37 people per square kilometer, Canada about 4.7, Australia about 3.5 and Mongolia only about 2.3. Greenland has about 0.1, roughly one person for every 10 square kilometers. The world as a whole averaged about 62 people per square kilometer in 2023.
World Bank data (2024 unless noted) span five orders of magnitude: Monaco about 18,537 people per km², Singapore 8,329, Bangladesh 1,333, the Netherlands 534, India 488, Japan 340, Nigeria 256, China 150, Egypt 117, the United States 37.2, Brazil 25.4, Canada 4.7, Iceland 3.8, Namibia 3.7, Australia 3.5, Mongolia 2.3 and Greenland 0.1. The world average was about 62.1 in 2023, the latest global value.
Two very small countries, Monaco and Singapore, top this list. Of the larger countries here, Bangladesh stands out, with more than a thousand people per km² across the whole country, while Mongolia and Greenland sit at the sparse end. National averages like these are only a starting point, because people are rarely spread evenly within a country.
Why people cluster
People like to live near water and good land for farms. They also live where there are jobs.
Very cold places, like icy Antarctica, have almost no one.
People are not spread out evenly. They tend to gather in clusters, with emptier land in between. Many clusters are near water. In Egypt, National Geographic says 95 percent of Egyptians live within a few miles of the Nile River, which gives them water for drinking and farming.
Cities are clusters too: towns and cities hold many people on small areas of land, while the countryside around them has far fewer. And some places have almost no one at all. Antarctica has no native population, the British Antarctic Survey says; the people there work at research stations.
Settlement concentrates where resources and opportunities are. The Nile is the classic case: National Geographic reports that 95 percent of Egyptians live within a few miles of the river, which supplies about 90 percent of the country's water; Egypt's national average of about 117 people per km² (World Bank, 2024) says nothing about this clustering. National Geographic describes the general pattern as clusters surrounded by sparsely inhabited areas, and notes that dense clusters generally coincide with cities and metropolitan areas.
At the other extreme, harsh environments support few or no permanent residents. Antarctica has no native population, according to the British Antarctic Survey. Migration reshapes the map continually: many people within countries have moved from rural to urban areas, adding people to cities.
When averages fool you
A country can have a big city and a big empty desert. The number for the whole country does not show that.
So geographers also look at small areas, like towns and neighborhoods.
One number for a whole country can be misleading. Imagine a country with one big, busy city and a huge empty desert. Its average density might be the same as a country where people are spread out evenly, even though the two places feel completely different.
That is why National Geographic says population density is most useful for small areas, such as neighborhoods. Geographers also use other kinds of density. One compares the number of people with the amount of land that can grow crops. This shows how much pressure there is to grow enough food.
National Geographic stresses that density says how many people live on a given area but not how they relate to the land: an area containing a large city and a desert may have the same density as one with an evenly spread population, though the two have little in common. Density is therefore more informative for small areas, such as neighborhoods, than for whole regions or countries.
Alternative measures address this. Physiological density divides the population by arable land, revealing the pressure on a country to produce enough food. Agricultural density compares the number of farmers or rural residents with the arable land. Grid-based methods such as the Degree of Urbanisation, which the UN used in 2025 to classify cities and towns, apply density thresholds to every square kilometer: a city needs at least 1,500 people per km² in a cluster of at least 50,000 people.
Why density matters
Knowing how many people live in a place helps plan schools, doctors, buses and homes.
Crowded places and empty places need different things.
Knowing population density helps people plan. National Geographic notes that it is used to think about crowding, housing, services, energy and moving goods from place to place.
Scientists use density figures in many ways: to study how people affect wildlife and nature, how illnesses spread, how much energy is needed and how goods are moved around. It even helps them study how crowded places affect people's lives.
Density data feed many fields. National Geographic lists ecology (how rising density affects biodiversity and natural resources), epidemiology (how disease incidence and transmission differ in dense areas), infrastructure (energy use and the transport of goods) and urbanization (overcrowding, housing shortages and the provision of services); agencies such as the World Health Organization use census or UN population data to anticipate resource use and health trends.
Global change makes these figures more important. The UN's World Urbanization Prospects 2025 finds that cities held 45 percent of the world's 8.2 billion people in 2025 and projects that two-thirds of population growth through 2050 will occur in cities, which means more people living at urban densities. Planning for water, housing, transport and services depends on knowing not just how many people there are, but where and how closely they live.
Amazing facts
-
Monaco is the most crowded country on this page.
Monaco has about 18,537 people per square kilometer, World Bank figures for 2024 show.
World Bank data for 2024 give Monaco about 18,537 people per km² of land area.
-
Almost everyone in Egypt lives near one river.
About 95 percent of the people of Egypt live within a few miles of the Nile River.
National Geographic reports that 95 percent of Egyptians live within a few miles of the Nile, which supplies 90 percent of Egypt's water.
-
Lights at night seen from space help count where people live.
China studies satellite pictures of lights at night to check where people live and how that is changing.
National Geographic notes that China analyzes nighttime light data from space sensors to confirm population density and predict change.
-
In the United States, everyone is counted every 10 years.
The U.S. Constitution requires a count of the population every 10 years.
The U.S. Constitution requires a decennial census, carried out by the U.S. Census Bureau.
Words to know
- population
- the number of people living in a place
- population density
- how many people live on each square kilometer (or mile) of land, on average
- square kilometer
- the area of a square that is 1 kilometer long on each side
- census
- an official count of all the people in a country or area
- densely populated
- having many people living close together
- sparsely populated
- having few people spread over a large area
- arable land
- land that can be used to grow crops
Discovery challenge
-
What does population density tell us?
What does population density measure?
Which ratio defines population density?
- How crowded a place is
- How hot a place is
- How old a place is
Show the answer
How crowded a place is
How crowded it is: how many people live there for its size.
How crowded a place is: the number of people divided by the land area.
Population divided by land area, usually people per km²; the World Bank uses midyear population and land excluding inland water.
-
Which of these places is the most crowded?
According to World Bank figures for 2024, which of these is the most densely populated?
Which of these had the highest population density in 2024 (World Bank)?
- Mongolia
- Bangladesh
- Canada
Show the answer
Bangladesh
Bangladesh! Lots of people live there for its size.
Bangladesh, with about 1,333 people per square kilometer. Canada has about 4.7 and Mongolia about 2.3.
Bangladesh, about 1,333 per km², versus Canada 4.7 and Mongolia 2.3.
-
In Egypt, where do most people live?
Where do 95 percent of Egypt's people live?
What explains the clustering of Egypt's population?
- Near the Nile River
- In the middle of the desert
- High on mountains
Show the answer
Near the Nile River
Near the Nile River, where there is water.
Within a few miles of the Nile, which gives water for drinking and farming.
Proximity to the Nile, which supplies about 90 percent of Egypt's water; 95 percent of Egyptians live within a few miles of it.
-
How do countries count their people?
What is a count of everyone in a country called?
What does the U.S. Constitution require every 10 years?
- A census
- A forecast
- A map key
Show the answer
A census
A census! It counts everyone.
A census. The United States and China hold one every 10 years.
A census, carried out by the U.S. Census Bureau; China also conducts one each decade.
Experiments to try
Explore next
- Watch Geography Villages, towns and cities A place where people live together is called a settlement. A village is a small settlement, often in the countryside. A town is bigger than a village but smaller than a city. A city is a large place with many people, buildings, roads and jobs. In 2025, the United Nations reported that 45 percent of the world's people live in cities.
-
 Watch
 Country
Bangladesh
Bangladesh is a low, flat country in South Asia, built by two great rivers, the Ganges and the Brahmaputra. Monsoon rains flood its fields each year, the Sundarbans mangrove forest lines its coast, and about 176 million people lived there in 2025.
-
 Watch
 Country
Mongolia
Mongolia is a large, landlocked country in Asia, between Russia and China. Most of it is a high plateau of grassy steppe, with mountains in the west and the Gobi in the south, and about 3.6 million people lived there in 2025.
-
 Watch
 Country
Singapore
Singapore is a city-state, a country that is also one city, on an island at the southern tip of the Malay Peninsula in Southeast Asia. It is small but crowded: about 6.21 million people lived there in 2026, and its port is one of the busiest in the world.
-
 Watch
Natural wonder
Nile
The Nile flows north through northeastern Africa to the Mediterranean Sea, and its basin is shared by 11 countries. Its length is usually given as about 6,650 kilometers. Two great branches, the White Nile and the Blue Nile, meet at Khartoum in Sudan, and the green strip of farmland along its banks made it the lifeline of ancient Egypt.
- Watch Try it What If? Lab What if animal populations grew beyond available food? Land can only feed so many animals. In our model, a herd of deer grows until it nears that number. But what if the deer react to crowding late? Watch the herd shoot past what the food can feed, then fall back, and meet real herds that did the same.
-
 Watch
Life around the world
Living in a vertical city: Hong Kong
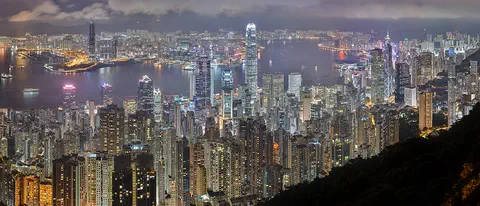
Hong Kong is hilly, and only about a quarter of its land is built on. Its 7.5 million people live close together, many in apartment buildings. A long chain of outdoor escalators climbs one hillside, ferries cross Victoria Harbour, and trains carry millions of passengers every day.
-
 Watch
City
Mumbai
Mumbai, once called Bombay, is a giant port city on India's west coast, by the Arabian Sea. It grew on seven small islands that were joined into one, and it is India's main center of business and banking. At the 2011 census, more than 12 million people lived in the city and more than 18 million in its urban area.
For parents & teachers
What children will learn
- Explain population density as people divided by land area.
- Read and compare real density figures, with their year and source.
- Explain why people cluster near water, farmland and cities.
- Recognize that averages can hide how unevenly people are spread.
Recommended ages: 7 to 14 · About 15 minutes
Talk about it
- Is your neighborhood densely or sparsely populated? What clues tell you?
- Why do you think so many people in Egypt live near the Nile?
- What might a very crowded city need that a quiet village does not?
Try at home or in class
- Mark out two squares of the same size with string. Put 5 toy figures in one and 50 in the other, then work out how many 'people' each square holds per square.
- Count the people living in your home and estimate its floor area in square meters, then work out people per square meter. Compare with a friend or relative.
- On a world map, color the countries from this page dark or light depending on whether they are crowded or have lots of space.
Key vocabulary: population, population density, square kilometer, census, densely populated, sparsely populated, arable land
Where these facts come from
- Population density (people per sq. km of land area), EN.POP.DNST , World Bank Open Data (World Development Indicators)
- Population Density , National Geographic Society (Education)
- Nile River , National Geographic Education
- World Population Prospects 2024 , UN DESA Population Division
- Cities are home to 45 per cent of the global population, with megacities continuing to grow, UN report finds , United Nations Department of Economic and Social Affairs
- Degree of Urbanisation definitions , European Commission, Global Human Settlement Layer
- Rural Area , National Geographic Society (Education)
- Antarctica , British Antarctic Survey
Checked, not yet human-reviewed. Last updated October 27, 2026. Spotted a mistake? Tell us.