
What If? Lab
What if animal populations grew beyond available food?
Deer need plants to eat. What if a herd grew bigger than its food could feed? Let's watch Olly's herd!
Land can only feed so many animals. In our model, a herd of deer grows until it nears that number. But what if the deer react to crowding late? Watch the herd shoot past what the food can feed, then fall back, and meet real herds that did the same.
Hutchinson's delayed logistic equation adds a time lag to population growth: animals respond to how crowded the land was years ago. When the growth rate times the lag passes π/2, the population overshoots its carrying capacity and keeps booming and crashing. Compare it with the St. Matthew Island reindeer.
The big question
A field of grass can feed some deer. But not too many!
What if more and more deer came? What would happen when there was not enough to eat?
Every patch of land grows a certain amount of grass, leaves and twigs each year. That amount can feed only so many deer. Scientists call this number the carrying capacity.
A herd with lots of food grows quickly. So what happens when it gets close to the carrying capacity? Does it stop neatly, or can it grow too big? In this lab you can find out by changing how quickly deer react to crowding.
A population with abundant resources grows almost exponentially. As it approaches the carrying capacity K, the number its environment can sustain, food per animal falls and growth should slow.
The catch is timing. Births today reflect conditions when the parents were feeding, months or years earlier. This lab asks what that delay does: can a population sail past K, and what happens after it does?
Try the experiment
Make a prediction
The deer notice the crowding late. What will the herd do?
The herd now reacts to crowding two years late. What happens when it gets close to the 500 deer the food can feed?
With r = 0.8 per year and a two-year lag, how does the population behave near K = 500?
- It grows past what the food can feed, then falls
- It stops right at the food limit
- It never grows at all
| Control | In our world | What if… | Range |
|---|---|---|---|
| How late the deer react · How many years late the herd reacts to crowding. Zero means at once; two years means the herd keeps growing on old news. | 0 years | 2 years | 0–3 years |
| Plant food grown each year · How many tonnes of plant food the land grows each year. With each deer needing 0.1 tonnes, 50 tonnes feeds 500 deer. | 50 t/yr | — | 1–100 t/yr |
| Deer at the start · How many deer live on the land when the run begins. | 20 deer | — | 2–500 deer |
| Growth rate with plenty of food · r: the intrinsic growth rate per head when food is not limiting (births minus deaths). | 0.8 per year | — | 0.1–2 per year |
| Food each deer needs · Tonnes of plant food one animal needs per year; K = food ÷ need. | 0.1 t/yr | — | 0.05–1 t/yr |
-
What the model shows
In the model, when deer react at once, the herd stops at the right size.
In the model, when deer react to crowding at once, the herd grows from 20 to about 350 in 5 years and settles at the 500 the food can feed, never passing it.
With τ = 0 the logistic curve gives about 347 deer at 5 years, 496 at 10 and K = 500 by 15, with no overshoot.
-
What the model shows
In the model, when deer react late, the herd grows too big and then shrinks.
In the model, with a two-year delay, the herd climbs to about 1,020 deer, about twice what the food can feed, then falls to about 160 and keeps booming and shrinking.
With τ = 2 (rτ = 1.6 > π/2) the herd peaks near 1,023 at 6.4 years with a food share of about 49 percent, crashes to about 161, and keeps oscillating.
-
Established fact
On one island, a reindeer herd grew very big and ate up its winter food.
On St. Matthew Island in Alaska, 29 reindeer brought in 1944 grew to about 6,000 by 1963, ate up their winter lichens, and only 42 were left by 1966.
St. Matthew Island reindeer rose from 29 (1944) to 6,000 (1963), eliminated lichens from their winter diet and starved in the extreme-snow winter of 1963–64, leaving 42 in 1966 (Klein 1968).
-
Established fact
Too many deer can eat all the little trees in a forest.
In Rock Creek Park, the National Park Service found that plants are damaged when there are more than 20 deer per square mile.
NPS research in Rock Creek Park shows vegetation damage above 20 deer per square mile; seedling density more than doubled after deer reduction began in 2013.
-
An idea scientists discuss
When plants get eaten up, it can take a long time for them to grow back.
Unlike our model, a real overgrazed place may grow less food for years, so a herd that grows too big can lower the carrying capacity itself.
Real overshoot can reduce K by damaging the food plants, as with St. Matthew's lichens; the model's fixed K cannot show this, so its recoveries are optimistic.
A herd that stops in time
Olly's land grows food for 500 deer.
The herd starts small. It grows and grows. Then it slows down and stops at 500. Everyone has enough to eat!
In the model, the land grows 50 tonnes of plant food a year, and each deer needs a tenth of a tonne, so the food can feed 500 deer. The herd starts with 20.
When the deer react to crowding straight away, the herd grows fast at first, reaching about 350 after 5 years. Then it slows and creeps up to 500, the carrying capacity, without ever passing it. Every deer gets all the food it needs.
The carrying capacity is K = food ÷ need = 50 ÷ 0.1 = 500 deer. With no delay (τ = 0) the model is the logistic equation dN/dt = rN(1 − N/K), with r = 0.8 per year.
From 20 deer, the solution N(t) = K / (1 + ((K − N₀)/N₀)·e^(−rt)) gives about 347 deer at 5 years, 496 at 10 and 500 by 15. The curve is an S shape that approaches K from below and never overshoots.
Reacting too late
Now the deer notice the crowding late. The herd keeps growing, even when food is running short.
Soon there are too many deer for the plants. Some deer go hungry, and fewer babies are born. The herd gets smaller, then grows again.
Now give the deer a two-year breeding delay: the herd reacts to how crowded it was two years ago. It keeps growing long after the food runs short.
In the model, the herd climbs to about 1,020 deer after six and a half years, about twice what the food can feed, so each deer gets only about half the food it needs. Then the herd falls to about 160 and climbs again. It keeps booming and shrinking, over and over.
With τ = 2 years, rτ = 1.6, just above π/2 ≈ 1.57, so the model predicts sustained oscillations. The herd peaks at about 1,023 deer after 6.4 years, roughly 2K, when food share is about 49 percent, then crashes to about 161 at 10.1 years. Later peaks are 919 and 866 deer, and the oscillation is still running after 40 years.
A one-year delay (rτ = 0.8, between 1/e and π/2) gives damped waves instead: a peak of about 564 deer after 6.1 years, a dip to 481, and then settling at 500.
Why it happens
Baby deer start growing before they are born. Their mothers ate when food was plenty.
So more babies come even after food gets short. That is why the herd grows too big.
In real herds, this year's babies come from mothers that fed months earlier, when food was more plentiful. So the herd keeps growing on yesterday's good news. By the time births slow down, there are already too many deer.
The model is simple. It has no predators, no disease and no seasons, and the plants always grow back to the same amount however hard the deer eat them. Its growth rate and food numbers were chosen to show the pattern clearly, not measured from a real herd.
The delay turns crowding into delayed negative feedback. Linearizing near K shows the behavior depends only on rτ: below 1/e the approach is smooth, between 1/e and π/2 it overshoots in damped waves, and above π/2 it settles into a repeating boom and crash.
Key assumptions: the plants regrow fully every year, so overgrazing never lowers K; one lag τ stands in for ages, seasons and breeding times; there are no predators, disease, hunting or migration; and the population is a smooth number that can fall to fractions of an animal and recover, which a real herd cannot. The rates are illustrative, not measured.
Real herds that grew too big
Long ago, people brought 29 reindeer to an island in Alaska. There was lots of food, so the herd grew very big.
The reindeer ate up their winter food, and the herd became small again. Parks today keep watch so plants and animals stay in balance.
In 1944, 29 reindeer were brought to St. Matthew Island in Alaska. With rich food, the herd grew to about 6,000 by 1963. The reindeer ate up the lichens they needed in winter, and after a winter of very deep snow only 42 were left by 1966.
White-tailed deer in Rock Creek Park in Washington, D.C., had no natural predators and flourished, reaching nearly 100 per square mile in 2003. Since the park began lowering deer numbers in 2013, its count of tree seedlings has more than doubled.
Klein (1968) described reindeer introduced to St. Matthew Island in 1944 rising from 29 to 6,000 by summer 1963. Lichens had been eliminated from their winter diet and body weights had dropped; in late winter 1963–64, with extreme snow, almost the whole population starved, leaving 42 in 1966. He concluded food supply, interacting with climate, regulated the herd. Unlike our model, where the food always regrows, the lichens themselves were eaten out, and all but one of the 1966 survivors were females: there was no rebound like the model's.
In Rock Creek Park, deer without natural predators reached nearly 100 per square mile in 2003; NPS research shows vegetation damage above 20 per square mile. Since deer reduction began in 2013, tree seedling density has more than doubled.
Amazing facts
-
Before 1960, no one wrote down seeing deer in Rock Creek Park. Later there were lots!
Before 1960, there were no recorded sightings of white-tailed deer in Rock Creek Park; by the early 1990s sightings were so common the park stopped counting them.
Rock Creek Park recorded no white-tailed deer before 1960; by the early 1990s sightings were too frequent to record, and density peaked near 100 per square mile in 2003.
-
The St. Matthew Island reindeer were very big at first, because they had so much food.
In 1957, St. Matthew Island's reindeer weighed much more than reindeer in farmed herds, because their food was so rich.
In 1957 the island's reindeer outweighed domestic-herd reindeer by 24–53 percent (females) and 46–61 percent (males); by 1963 their weights had fallen to domestic levels.
-
Reindeer eat lichens in winter.
By 1963, the St. Matthew Island reindeer had eaten so much that lichens had all but disappeared from their winter food.
By 1963 lichens were no longer a significant part of the herd's winter diet, and sedges and grasses were spreading where lichens had grown.
Words to know
- population
- all the animals of one kind living in one place
- carrying capacity
- the largest number of animals the food and space in a place can support
- overshoot
- when a population grows past what its food can support
- delay
- a gap in time between a cause and its effect
- lichen
- a small, crusty living thing; the St. Matthew Island reindeer ate it in winter
- overgrazing
- when animals eat plants faster than the plants can grow back
Discovery challenge
-
What is the biggest number of deer the food can feed called?
What do scientists call the largest number of animals a place's food can support?
The population size an environment can sustain is called its…
- Carrying capacity
- Food chain
- Life cycle
Show the answer
Carrying capacity
It is called the carrying capacity. Here it is 500 deer.
The carrying capacity. In the model it is the food grown each year divided by what one deer eats: 500 deer.
…carrying capacity, K; here K = food ÷ need = 500.
-
When deer notice the crowding late, what does the herd do?
In the model, what happens when the herd reacts to crowding two years late?
With r = 0.8 per year and τ = 2 years, the model population…
- Grows past the food limit, then falls
- Stops right at the food limit
- Shrinks from the very start
Show the answer
Grows past the food limit, then falls
It grows too big, then gets smaller.
It overshoots to about 1,020 deer, about twice what the food can feed, then falls to about 160.
…overshoots to about 1,023 and keeps oscillating, because rτ = 1.6 exceeds π/2.
-
What did the reindeer on the island eat up?
What winter food did the St. Matthew Island reindeer eat up?
Which part of the St. Matthew Island reindeer's winter diet had been eliminated by 1963?
- Lichens
- Fish
- Insects
Show the answer
Lichens
They ate up the lichens.
Lichens. Once they were gone, the herd had little to eat in a very snowy winter.
Lichens; sedges and grasses spread into the sites they had covered.
-
What is different about the food in the model?
How is the model different from St. Matthew Island?
Which real effect does the model leave out?
- In the model, the food always grows back
- In the model, there is no food at all
- In the model, deer never have babies
Show the answer
In the model, the food always grows back
In the model the grass always grows back, but real plants can be eaten up.
The model's food always regrows to the same amount, but on the island the lichens were eaten out.
Damage to the food supply: the model keeps K fixed, while real overgrazing can lower it.
Experiments to try
- Watch Try it What If? Lab What if a habitat lost its water supply? Water makes plants grow, and plants feed animals. In our model, a dry spell cuts the plant food from 50 tonnes a year to 20, so the land can feed far fewer deer. Watch the herd shrink to fit, then find out how drought affects real wildlife and how people help.
- Watch Try it What If? Lab What if rabbits had more babies? Rabbits are famous for having lots of babies. So if every rabbit in a meadow had babies twice as fast, you would expect a meadow full of rabbits. In our rabbit and fox model, something surprising happens instead: the extra rabbits mostly end up feeding more foxes.
- Watch Try it What If? Lab What if there were no predators? In a meadow, rabbits have babies and foxes hunt them, so both numbers rise and fall in turns. Take every fox away in our model and watch what the rabbits do, then find out what happened in a real park when its wolves were taken away and brought back.
Explore next
-
 Watch
Animal
White-tailed deer
White-tailed deer live in forests, fields and even towns from Canada down to South America. They are named for the white underside of the tail, which they hold up like a flag when they run. Males grow new antlers every year.
-
 Watch
3D
Animal
Reindeer
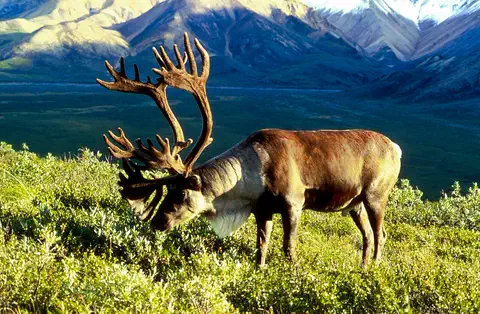
Reindeer, called caribou in North America, are deer of the Arctic tundra and northern forests. They are the only deer in which females grow antlers too. Some herds walk thousands of kilometers a year, and people in northern Europe and Asia have herded reindeer for a very long time.
- Watch Try it What If? Lab What if a habitat lost its water supply? Water makes plants grow, and plants feed animals. In our model, a dry spell cuts the plant food from 50 tonnes a year to 20, so the land can feed far fewer deer. Watch the herd shrink to fit, then find out how drought affects real wildlife and how people help.
- Watch Try it What If? Lab What if rabbits had more babies? Rabbits are famous for having lots of babies. So if every rabbit in a meadow had babies twice as fast, you would expect a meadow full of rabbits. In our rabbit and fox model, something surprising happens instead: the extra rabbits mostly end up feeding more foxes.
- Watch Try it What If? Lab What if there were no predators? In a meadow, rabbits have babies and foxes hunt them, so both numbers rise and fall in turns. Take every fox away in our model and watch what the rabbits do, then find out what happened in a real park when its wolves were taken away and brought back.
- Watch Geography Population density Population density tells you how crowded a place is. You find it by dividing the number of people by the area of land they live on, usually as people per square kilometer. Among countries, World Bank figures for 2024 range from more than 18,000 people per square kilometer in Monaco to about 2 in Mongolia. People cluster where there is water, farmland and work, and leave harsh places almost empty.
- Watch Try it What If? Lab What if elephants talked with very low sounds? Elephants really do talk with very low rumbles, some too low for people to hear. Turn the pitch down in our sound model and see what changes about the wave, then find out how far real elephant calls can carry.
- Watch Try it What If? Lab What if fish had no swim bladder? Most bony fish carry a gas-filled pouch called a swim bladder. It makes the fish almost exactly as heavy for its size as the water around it, so it can stay at one depth without sinking or floating up. Use a floating-and-sinking model to see what happens when the gas is taken away.
For parents & teachers
What children will learn
- Every habitat has a carrying capacity: the number of animals its food and space can support.
- Populations that respond to crowding late can overshoot their carrying capacity and then decline.
- Real overshoots, such as the St. Matthew Island reindeer, can damage the food supply itself.
- Park managers monitor animal numbers and plants to keep habitats healthy.
Recommended ages: 9 to 17 · About 15 minutes
Talk about it
- Why might baby animals keep being born even after food starts running short?
- What could make a habitat's carrying capacity go up or down?
- Why do you think islands without predators sometimes see big booms and crashes?
Try at home or in class
- Use a bowl of 50 cereal pieces as 'food' and add 'deer' (counters) each round, two at a time, but only check whether there is enough food every other round. Record when the deer outnumber the food.
- Draw the model's two curves (reacting at once and reacting late) on graph paper and mark the carrying capacity line.
Key vocabulary: population, carrying capacity, overshoot, delay, lichen, overgrazing
Where these facts come from
- The introduction, increase, and crash of reindeer on St. Matthew Island (Klein 1968, Journal of Wildlife Management) , Fire Research and Management Exchange System (FRAMES)
- Bering Sea Ice Expedition 2007: Questions and Answers (St. Matthew Island) , NOAA Pacific Marine Environmental Laboratory
- White-Tailed Deer Management , Rock Creek Park (U.S. National Park Service)
Checked, not yet human-reviewed. Last updated October 23, 2026. Spotted a mistake? Tell us.